Positioning Analysis
| What you put in... | What you get out... |
|
|
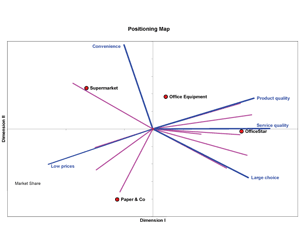
Positioning Analysis software incorporates several mapping techniques that enable firms to develop differentiation and positioning strategies for their products. By using this tool, managers can visualize the competitive structure of their markets as perceived by their customers. Typically, data for mapping are customer perceptions of existing products (and new concepts) along various attributes, customer preferences for products, or measures of behavioral response of customers toward the products (e.g., current market shares of the products).
 Positioning Analysis uses perceptual mapping and preference mapping techniques. Perceptual-mapping helps firms to understand how customers view their product(s) relative to competitive products. The preference map introduces preference vectors or ideal points for each respondent on to a perceptual map. The ideal point represents the location of the (hypothetical) product that most appeals to a specific respondent. The preference vector indicates the direction in which a respondent’s preference increases. In other words, a respondent’s “ideal” product lies as far up the preference vector as possible. The preference map starts out with a perceptual map giving the locations of the product alternatives. In the second step, it introduces for each respondent either an ideal brand or a preference vector.
Positioning Analysis also helps firms to answer such questions as:
- Based on customer perceptions, which target segments are the most attractive?
- How should we position our new products with respect to our existing products?
- How do our customers view our brand?
- What product name is closely associated with the attributes that our target segment perceives as desirable?
- Which brands do our target segments see as our closest competitors?
- What product attributes are responsible for the perceived differences between products?
- How would changes in a product's perceived attributes alter the product's market share?

